

The Synergy Project
at the Exploration Zone
An Exhibition at the Intersection of Art & Science
Background artwork: “Bloom” — Keith Prue
LatesT POSTS ABOUT SYNERGY AT THE EXPLORATION ZONE


About Synergy
Background artwork: “Drifters (Detail)” — Kathy Hodge
The Synergy Project is a collaboration between Art League RI (ALRI) and the Woods Hole Oceanographic Institution (WHOI) to express ocean science research through artistic expression. The project pairs scientists with artists to collaborate and create a ‘common language’ using the arts to illustrate and communicate science.
Discover how collaborative explorations between the two reveal new perspectives and deepen our understanding of the ocean, the environment, the relationships between them, and our role within it.

EDUCATION & Learning
Background artwork: “Detail of Blue Squid” — Deb Ehrens
Below you will find information regarding three different projects, Marine Heatwaves, which focuses on the ocean phenomenon of the same name; Arctica Islandica, a project about the life of the ocean quahog; and Drifters, which looks into the lives of Atlanic bluefin tuna larvae. All of these projects were part of the Below the Surface exhibition, and more details about each of them is available in the Projects section of the Below the Surface page. Additional reading can also be found at the bottom of this section.
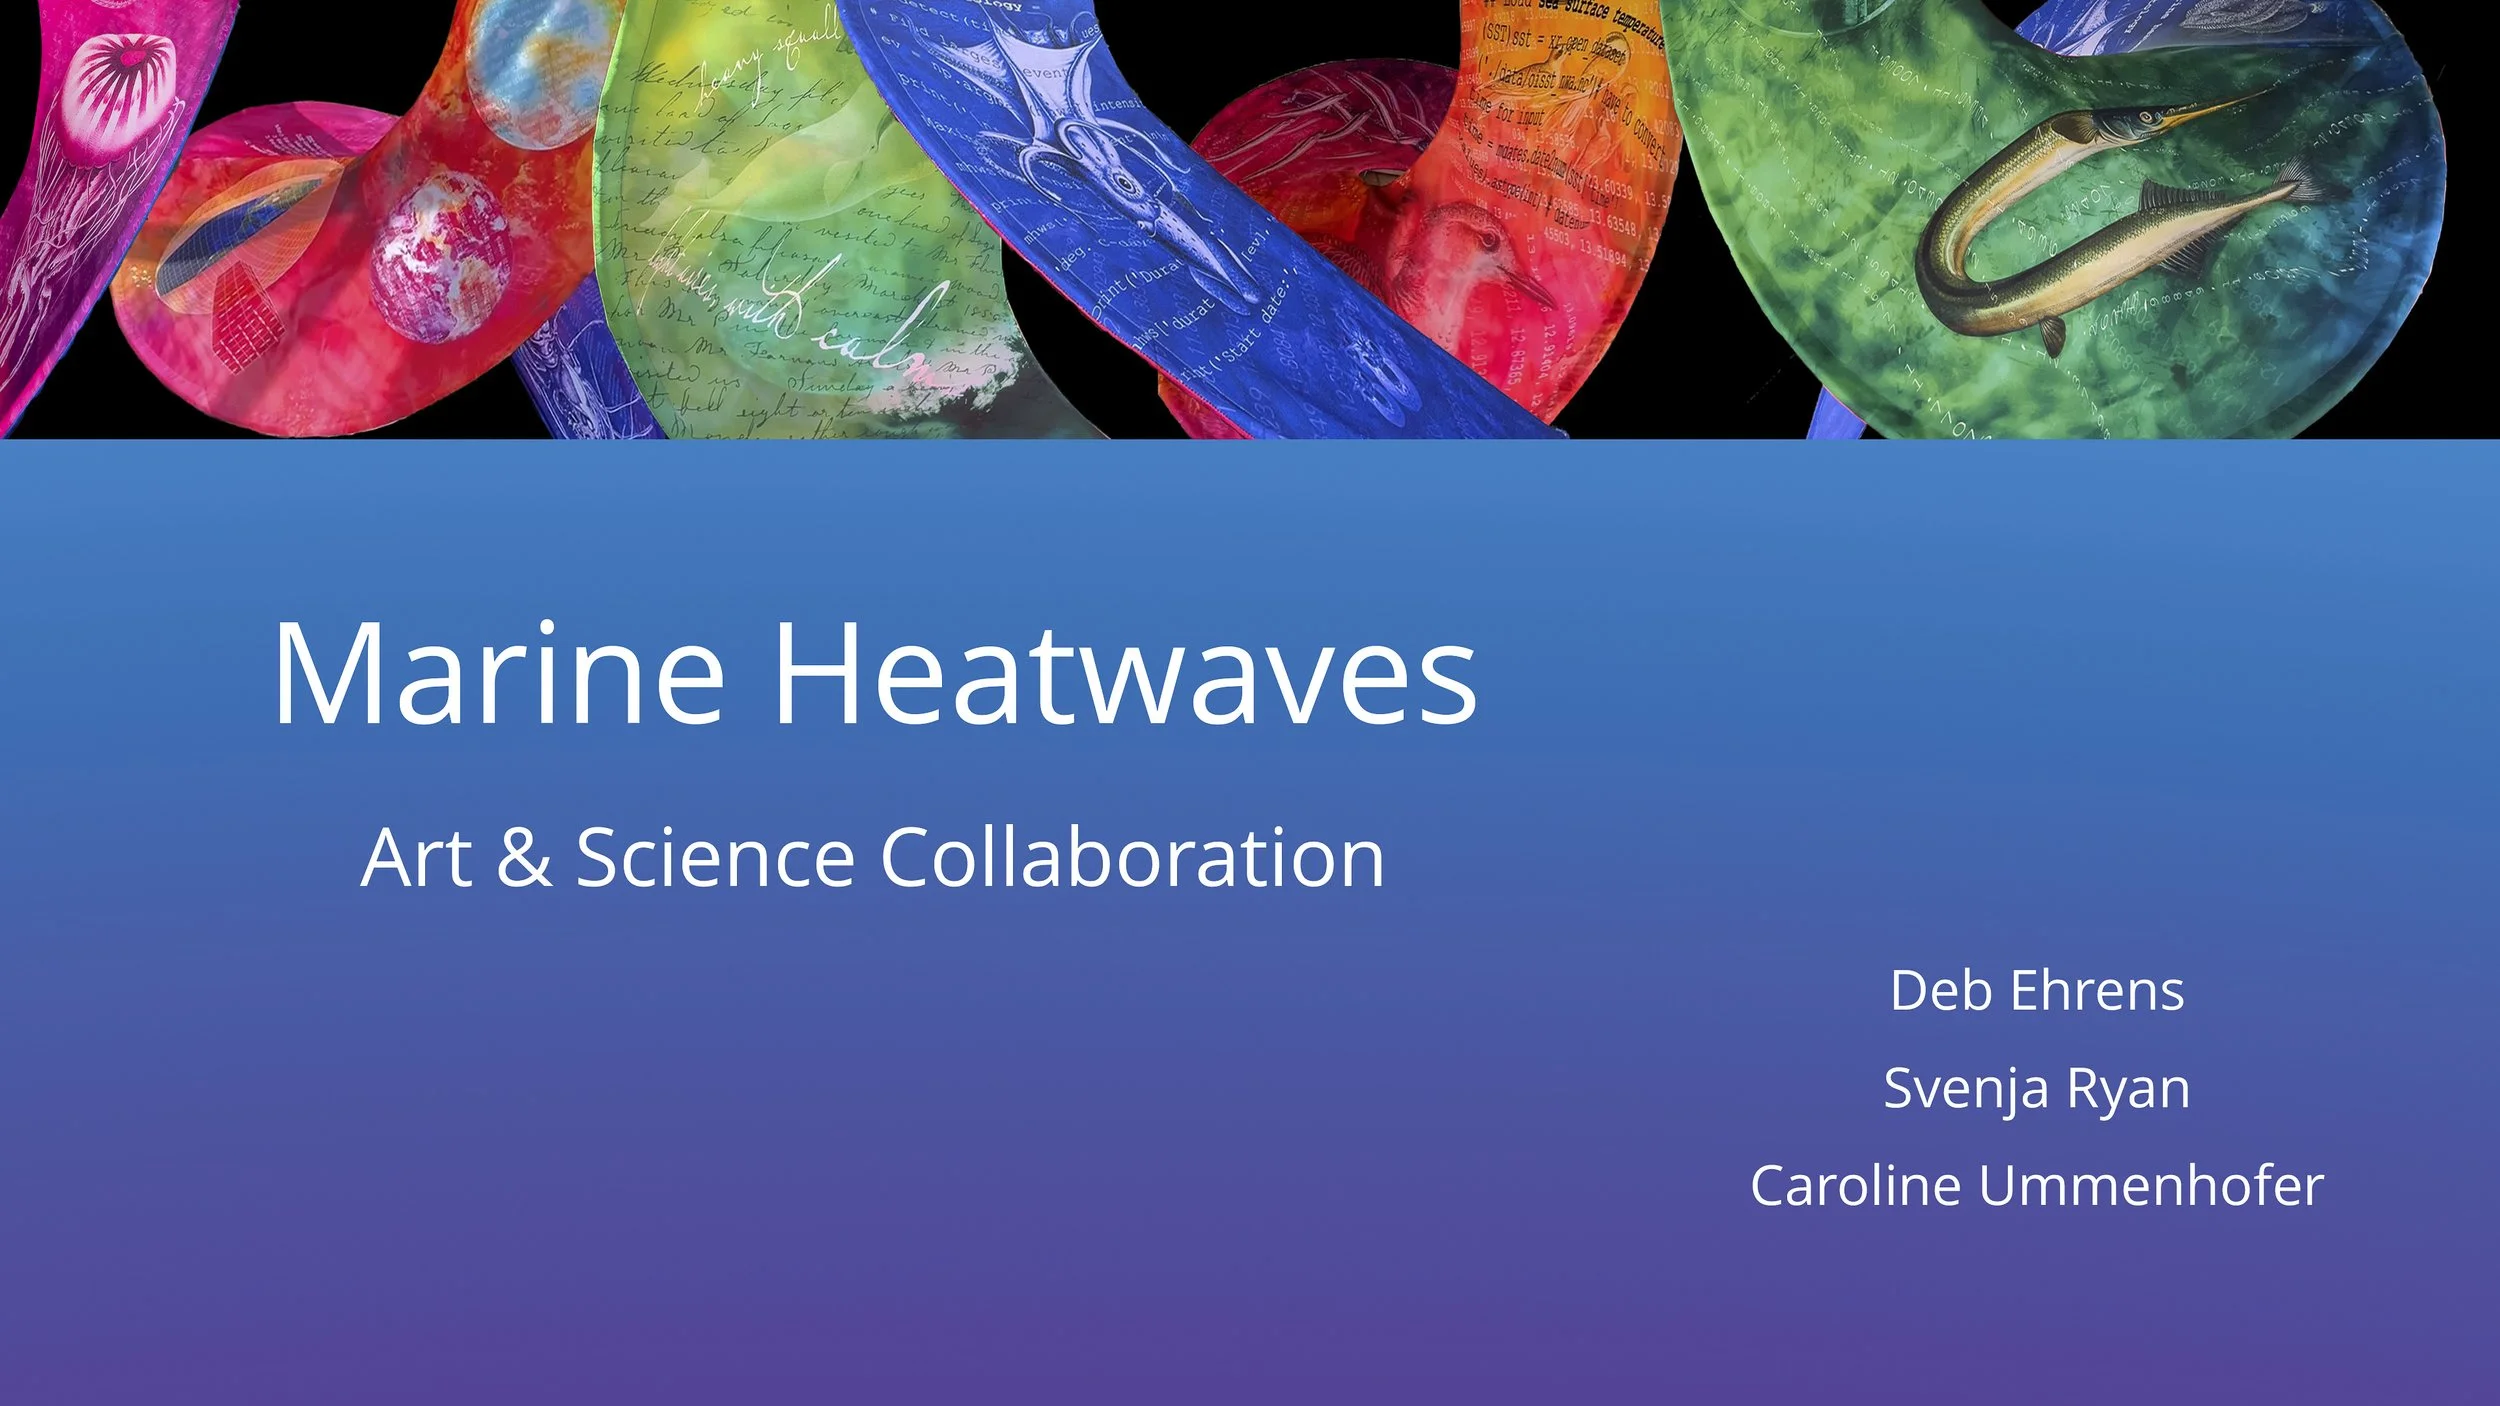
Marine Heatwaves
by Deb Ehrens, Svenja Ryan, PhD, & Caroline Ummenhofer, PhD
What Are Marine Heatwaves
Marine heatwaves, MHWs, are extreme events in the ocean when temperatures are well above the long-term average. As global temperatures rise, MHWs are becoming more frequent, more intense, and dramatically impacting marine biodiversity and fisheries. Changes in ocean currents and atmospheric heating of the ocean are the most common causes of MHWs. The warm core rings spinning off the Gulf Stream, which influence New England's MHWs, inspired the design of these spinning sculptures. Oceanographers define, describe, and predict MHWs using observational tools, historical records, data analysis, and computer models.
The Food Web
Marine Heatwaves, MHWs, affect the entire ocean food web, from the smallest single-celled phytoplankton to the top predators. They force species to adapt, move to cooler waters or die. The 2012 MHW was a disaster for New England's lobster fisheries. MHWs decimated entire kelp forest ecosystems off the California and Australian coasts. Seabirds starve when the fish they feed on disappear. Understanding the changing distribution of marine life is essential to our marine industries.

“Marine Heatwaves” — Deb Ehrens

"Detail of Green Gar 2" — Deb Ehrens
“Records by whalers 250 years ago can [...] inform contemporary climate science.”
Tools
Oceanographers use a wide range of observational tools. Traditionally depth profiles of temperature, salinity, and pressure are collected with a CTD (Conductivity-Temperature-Depth) rosette, lowered from a research vessel. Free-falling probes, called eXpendable BathyThermographs (XBT), deployed from commercial ships also collect temperature profiles. Since the early 1980s, satellites have provided us with data on a global scale. Measurements of ocean surface temperature, sea level, surface currents, chlorophyll, and ocean surface salinity revolutionized our understanding of ocean processes. This data helps us build more effective climate models.
HISTORICAL RECORDS
A rich trove of historical maritime weather data resides in ships' logs. Officers used sextants and chronometers to record their precise location and noted the weather conditions every day of the journey. Spanning the period 1790-1910, more than 4,500 whaling logbooks in New England archives provide unique insights into winds over some of the most remote ocean areas, far from navy or merchant shipping routes. The descriptive yet systematic terms used in whaling logs can be transferred to quantitative wind speeds using the Beaufort wind force scale to compare with modern data. Records by whalers 250 years ago can thus inform contemporary climate science.
DATA ANALYSIS AND VISUALIZATION
Big data and more powerful computers allow the analysis of larger datasets.
Numbers, numbers, numbers: A fundamental aspect of our work is processing, analyzing, and visualizing the data (numbers) that represent observed ocean properties or output from a computer model. With increasing amounts of data, we rely on powerful computers, aptly named supercomputers. We write code to communicate our analyses to the computer, run ocean models and produce graphics that illustrate our findings.
COMPUTER SIMULATIONS
Oceanographers use sophisticated computer simulations based on equations to understand and describe processes in the ocean and atmosphere. These numerical models create vast amounts of data that provide a comprehensive view of oceanic and atmospheric conditions through space and time. They allow us to investigate processes throughout the water column, away from the well-observed surface layer; they help fill in gaps in space and time between sparse observations and make projections of future changes.
Download the PowerPoint
For condensed, easy-to-share information about Marine Heatwaves, check out the PowerPoint here!
More about Marine Heatwaves
Follow the links below to learn more about the Marine Heatwaves project and its creators, Deb Ehrens, Svenja Ryan, PhD, and Caroline Ummenhofer, PhD.
Arctica Islandica
By Claire Marschak and Nina Whitney, PhD

An Arctica Islandica shell perches on the railing of the ESS Pursuit, off the coast of New Jersey
Our very best instrumental records go back continuously just a little over 150 years. While that is greater than the lifespan of humans and therefore seems like a long time, geologically speaking that is very little time at all. It is clear from numerous scientific studies that the world’s oceans and atmosphere are warming today as a result of human-caused climate change but it is critical to have a longer context than 150 years in order to understand the extent of this warming and the natural variability in the climate before major human influences so that we might understand the true scope of the climatic changes we observe today.
This climatic context is the goal of the field of paleoclimatology. Paleoclimatology uses geological archives to understand and reconstruct past climate changes. The paleoclimate work we focus on here uses the clam the ocean quahog (Arctica islandica) as a paleoclimate proxy. Ocean quahogs are the longest living, non-colonial animals in the world: They can live for over 500 years and they grow their shell in annual layers, similar to trees. The chemistry in these shells preserves information about environmental conditions at the time that each layer of shell was formed. Therefore, scientists can use ocean quahogs shells to determine what water temperature and other ocean conditions were hundreds of years ago.

“Arctica Islandica" — Claire Marschak
500 Years in the Life of a Clam
1520
1522: Magellan and crew sail around the world, proving the earth is round
1524: Giovanni de Verrazana sails into Narragansett Bay, spending time with the Narragansett and Wampanoag tribes
1535–1541: Michelangelo paints The Last Judgment in the Sistine Chapel in Italy
1543: Nicolaus Copernicus publishes On the Revolution of Heavenly Bodies, stating the sun is the center of the universe and the earth revolves around it
1600
1600: The Scientific Revolution begins
1620: The Mayflower arrives in Plymouth, Massachusetts
1631–1653: The Taj Mahal is built in India
1644: Fall of the Ming Dynasty, caused in part by poor harvests from cold temperatures of the Little Ice Age
1665: Dutch artist Vermeer paints Girl with a Pearl Earring
1666: Great Fire of London
1700
1700s: The Age of Englightenment begins in Europe
1752: Benjamin Franklin invents the lightning rod
1760: The start of the Industrial Revolution in England and America
1762: Wolfgang Amadeus Mozart tours Europe as a 6-year-old prodigy
1776: The US colonies approve the Declaration of Independence on July 4
1799: Rosetta Stone found in Egypt
1800
1820: Katsushika Hokusai creates the print The Great Wave off Kanagawa
1861–1865: American Civil War
1889: Vincent Van Gogh paints Starry Night, the Eiffel Tower is built in Paris as a symbol of industry
1872–1890: Yellowstone, Yosemite, and Sequioa National Parks are founded
1896: Svante Arrhenius studies the effects of CO2 from Industrial Revolution and the use of fossil fuel on climate change
1900
1901: First Nobel Prizes are awarded in physics, chemistry, medicine, peace, and literature
1914: Panama and Cape Cod canals are built
1932–1937: Massive drought leads to Dust Bowl, a result of cooler Pacific Ocean and warmer Atlanic Ocean
1962: Andy Warhol creates Campbell's Soup Cans and Marilyn Monroe pop art
1970: First Earth Day
2020
2001: September 11 terrorist attacks on New York City and Washington, D.C.
2005: Hurricane Katrina devastates the Gulf Coast
2007: Apple releases the iPhone
2013: Atmospheric CO2 reaches 400ppm for the first time in recorded human history and the first time in 3–5 million years
2016: Hottest year for global temperature
2020: Covid-19 global pandemic begins
Did You Know?
Ocean quahogs (Arctica islandica) can live up to 500 years and grow their shells in annual increments in response to the environmental conditions they are exposed to, just like trees.
The chemical composition of ocean quahog shells can tell us what the temperature was at the time that that shell formed (even if it formed hundreds of years ago). Ocean observations, computer model simulations, and climate proxies such as clam chemistry all tell us that the western North Atlantic has warmed more rapidly than much of the world’s ocean recently.
Download the PowerPoint
PowerPoint coming soon!
More about Arctica Islandica
Follow the links below to learn more about the Arctica Islandica project and its creators, Claire Marschak and Nina Whitney, PhD.
DRIFTERS
by Kathy Hodge & Chrissy Hernandez, PhD
Atlantic bluefin tuna are amazing, powerful, and (for many) a delicious source of food. These ocean giants are known for swimming across huge distances every year, between their summer feeding grounds in the Gulf of Maine (or even further north) and their spring spawning sites in the Gulf of Mexico. They can grow to be larger than a human and live to be about 40 years old.
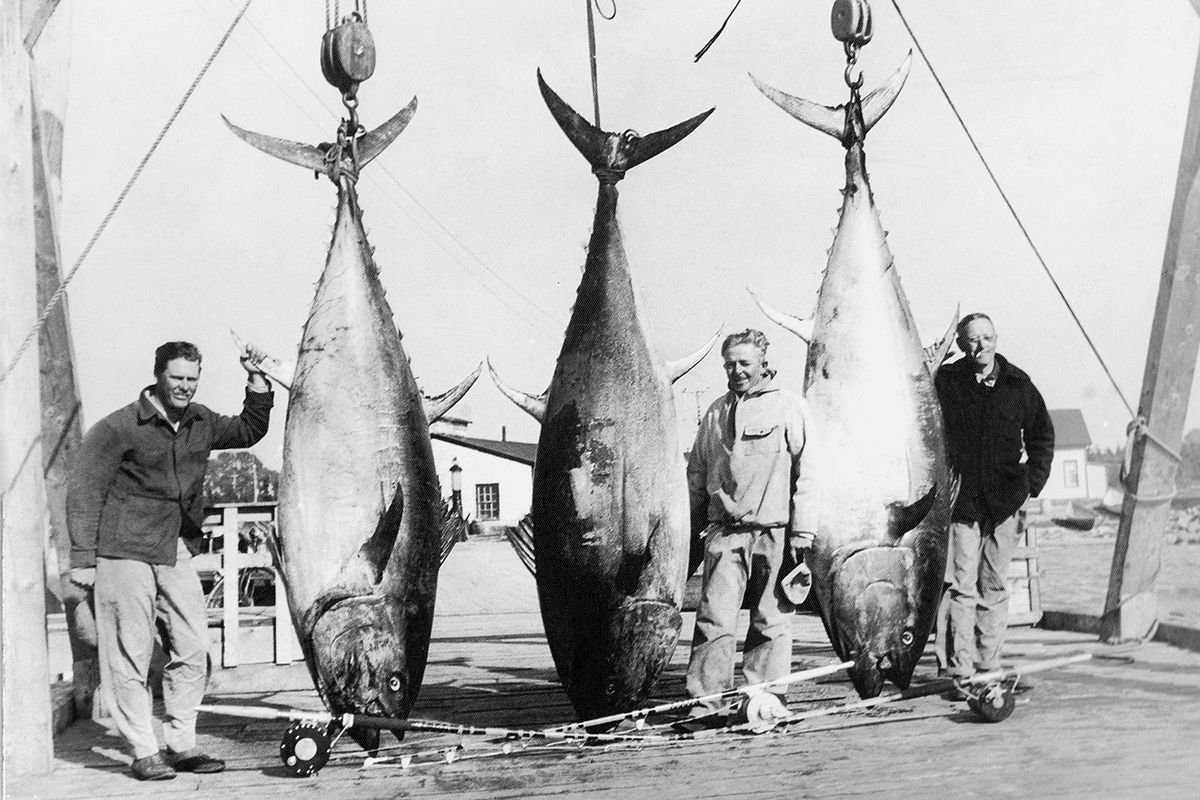
3 fisherman pose with bluefin tuna they caught. Each tuna is much longer than they are tall! Source: web.colby.edu

A 7–10 day old larva on Chrissy Hernandez’s fingertip.
However, these ocean giants start out extremely tiny: at hatching, a bluefin tuna larva is only about 3 mm in length, and looks a little bit like a tiny, clear worm. Most photos you will find are of larvae that have been preserved in alcohol, which turns their tissue white. But in the ocean, they are almost invisible until they start to develop pigment and scales.
Early in their lives, these tiny larvae are “drifters” along with all of the other planktonic organisms. Plankton is a general term for aquatic organisms that do not swim against ocean currents, and it can include everything from marine bacteria, to copepods, to jellyfish
Fish produce many many eggs that hatch into larvae, but most of these will not survive. Because of this, the number of adult fish is very sensitive to the events of early life-- in other words, because we are talking about millions of babies, a small change in the percentage of babies that survive can cause a big change in the number of adults! For this reason, scientists study fish larvae to understand the factors in early life that affect growth and survival.
“Drifters”, a triptych painting by Kathy Hodge, is based on research by Chrissy Hernandez (as part of her PhD at WHOI). Chrissy studied bluefin tuna larvae in a newly-recognized spawning ground for Atlantic bluefin tuna, in a region known as the Slope Sea.

Map showing important regions for Atlantic bluefin tuna spawning, including the Gulf of Mexico, Mediterranean Sea, and the Slope Sea. Reference: Richardson et al. 2016 PNAS

Bluefin tuna larval sampling locations by NOAA research vessels in the Slope Sea in June/July/August of 2016. At the locations indicated by circles, Chrissy and her colleagues identified bluefin tuna larvae. Image credit: Hernández et al. 2022 CJFAS

A larval bluefin tuna otolith taken under very high magnification. Can you see the rings? They each correspond to one day of growth! How old do you think this bluefin tuna larva was? Photo credit: C. Hernandez
Chrissy identified bluefin tuna larvae collected across the Slope Sea in 2016, and Kathy placed lenses on the leftmost panel of “Drifters” to correspond to the collection locations. Chrissy also studied the otoliths, or ear bones of the larval fish; much like tree rings, these otoliths record the age and growth of fishes. In larvae, they tell us the fish’s age in days!
Chrissy’s research helped to demonstrate that bluefin tuna spawn across a large area of the Slope Sea region, and that the larvae found there grow are growing at the same rate as larvae found in the Gulf of Mexico (a region that has been studied for much longer). With climate change, the Gulf of Mexico could become too hot for bluefin tuna spawning. Additional spawning areas such as the Slope Sea could provide a refuge for bluefin tuna to continue reproducing, helping to prevent the loss of these amazing fish.
The mighty bluefin tuna starts its life as a tiny fragile larva in the midst of a floating constellation of plankton. These oceanic “drifters” are a beautiful reminder of the interconnectedness of the ocean, atmosphere, and us: tiny photosynthetic plankton that feed the copepods that feed the fish larvae, that grow up to feed us.

“Drifters Triptych” — Kathy Hodge
Did You Know?
Most fish larvae are only a few millimeters long and they cannot swim very well. They don’t have strong fins yet!
Bluefin tuna can tuck in their dorsal fin (the one on the top of their back) when they want to swim super fast.
Bluefin tuna can grow to be much larger than a human, but they start out smaller than your fingernail!
In order to conserve threatened species, it is crucial to know where they spawn.
Fish ear bones, called “otoliths,” show rings that, like tree rings, tell us the age of the fish.
Further Reading
Video of bluefin tuna hunting “bait ball”:
https://www.youtube.com/watch?v=r1m6IKiO26c&ab_channel=oceancontent
Video of ocean currents-- NASA’s “Perpetual Ocean”:
https://www.youtube.com/watch?v=JQaEKk569Ew&ab_channel=NASAScientificVisualizationStudio
NOAA blog post about a cruise sampling for bluefin tuna larvae in 2017 (Chrissy was onboard, but didn’t write this blog post):
https://nefsc.wordpress.com/2017/06/15/searching-for-atlantic-bluefin-tuna-larvae-and-more-in-the-slope-sea/
Student drifter project where we released some satellite-tracked drifters in the Slope Sea in 2017:
https://studentdrifters.org/research/bluefintunalarvae/
Great additional videos and information at Planet Tuna
https://planettuna.com/en/homeeng/
Download the PowerPoint
For condensed, easy-to-share information about Drifters, check out the PowerPoint here!
More about DRIFTERS
Follow the links below to learn more about the Drifters project and its creators, Kathy Hodge and Chrissy Hernandez, PhD.
Additional Reading
More information about other projects on display at the Exploration Zone can be found below.
Bloom
"Bloom" — Keith Prue
Bloom, by Keith Prue and Suzanna Clark, PhD, looks at the topic of Harmful Algal Blooms (HABs). For more information, follow the links below.
From Sea Salt to Rainfall
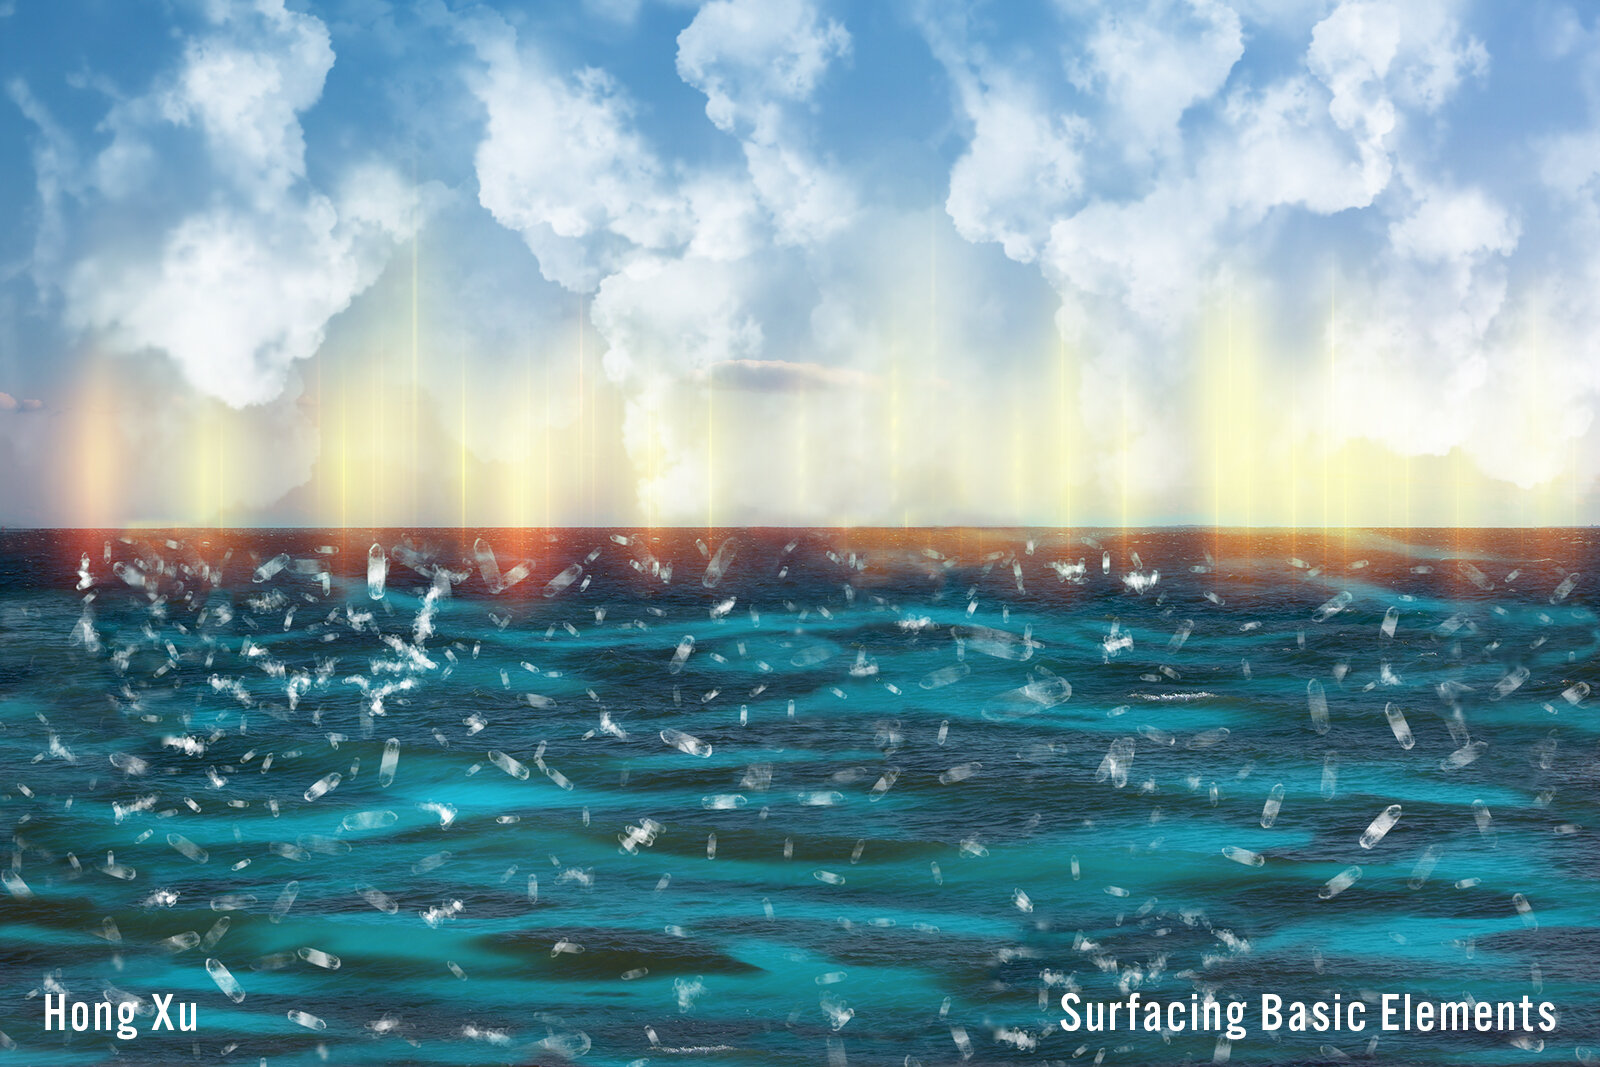
"Surfacing Basic Elements" — Hong Xu
Surfacing Basic Elements, by Hong Xu and Caroline Ummenhofer, PhD, visualizes the way in which ocean surface temperature and salinity influence rainfall on land. For more information, follow the links about
Oceans of Time

"Oceans of Time I" — Marcy Cohen
Oceans of Time, by Marcy Cohen and Sujata Murty, PhD, is a series of artworks that explores how we can look at climate change over time through coral. For more information, follow the links below.
PURSUIT & DECAY

"Ocean Breath" — Laurie Kaplowitz
Pursuit and Decay, by Laurie Kaplowitz and Jennifer Kenyon, PhD, is a graphic story that depicts the journey of carbon from the atmosphere to the deep ocean. For more information, follow the links below.

Get Connected
Background artwork: “Phytoplankton in Ocean” — Laurie Kaplowitz
INterest Survey
Thank you for your interest in The Synergy Project! To help us get a better idea of what visitors would like to see in the future, please take this quick survey to provide us feedback!
Newsletter
To stay up to date on all the latest news about The Synergy Project, make sure to subscribe to our newsletter. We’ll let you know the next time The Synergy Project will be on display!
Social Media
Updates about The Synergy Project are shared through Art League RI’s social media accounts. Visit our Contact page through the button below to find links to all of our accounts.

Host a Synergy Project Exhibition
If you have a gallery or other space and would like to host a Synergy Projecy exhibition, contact us to discuss it!